Grafana
Overview
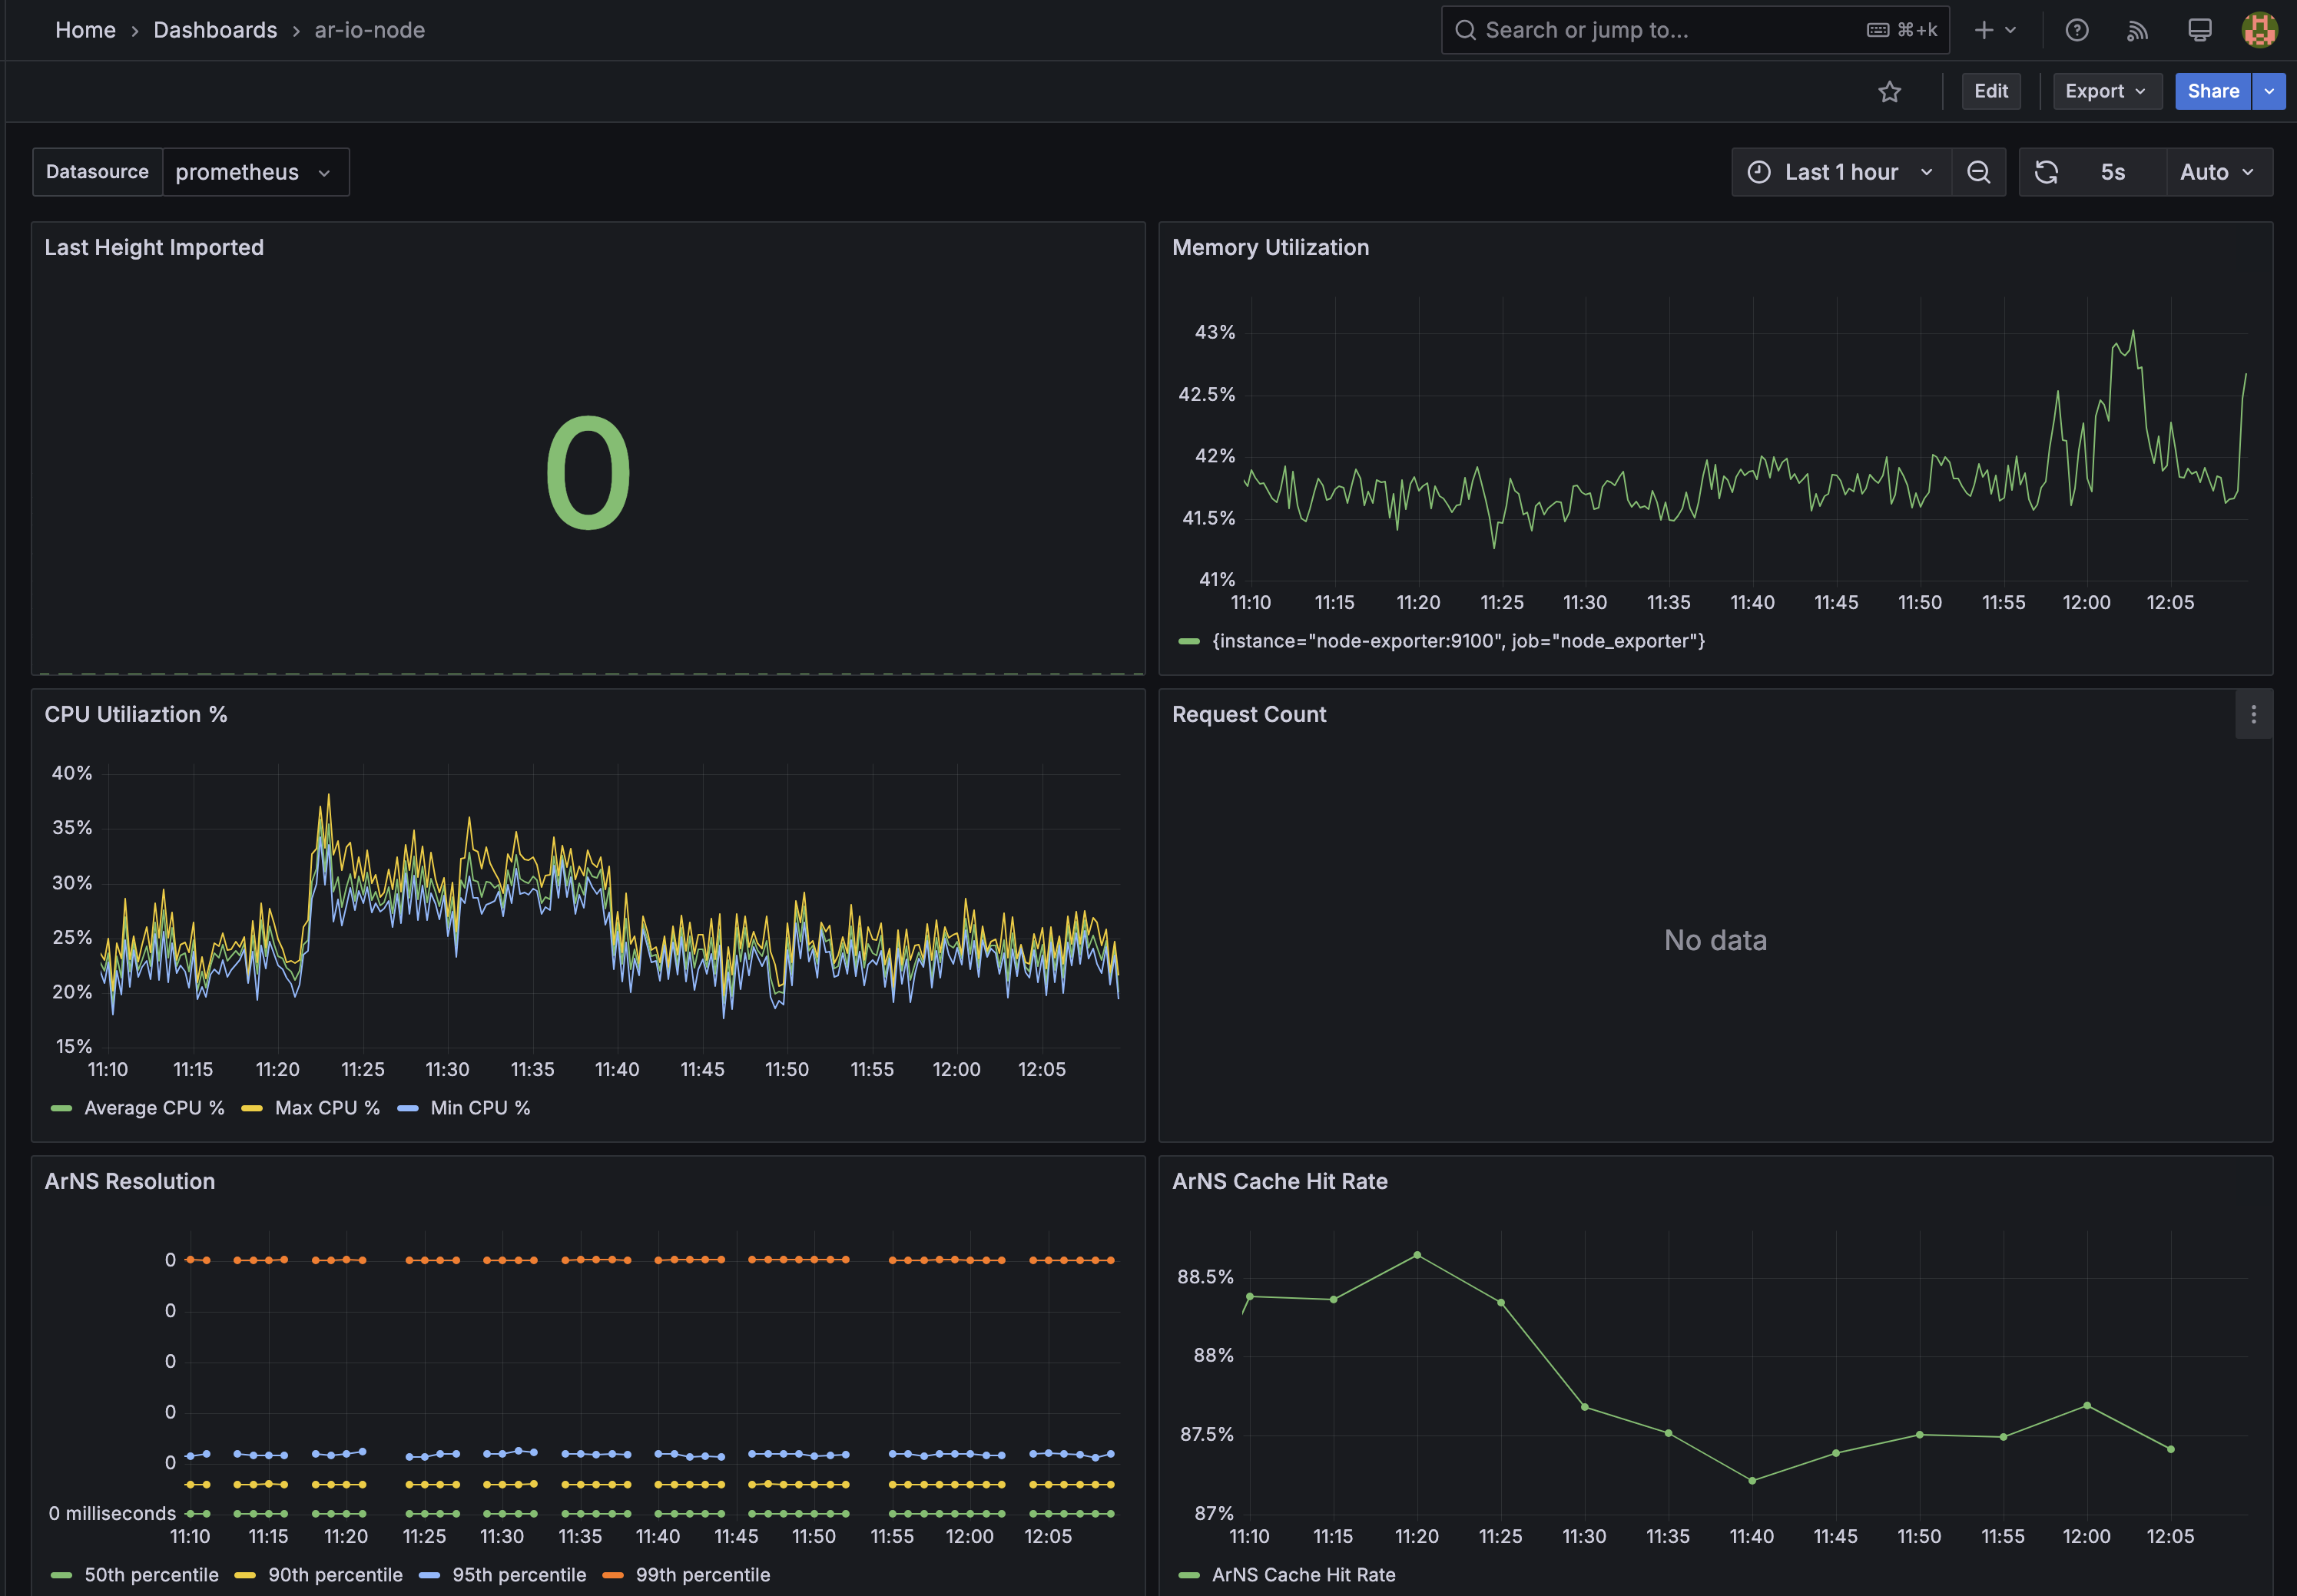
Ar.io gateways track extensive performance and operational metrics using Prometheus. A Grafana sidecar can be deployed to visualize these metrics, providing an easy way to monitor gateway health and performance.
The Grafana sidecar is deployed as a separate Docker container that uses the same network as the gateway, making it simple to integrate with your existing setup.
Quick Start
Deploy Grafana
Deploy the Grafana sidecar using the provided Docker Compose file:
docker compose -f docker-compose.grafana.yaml up -dTerminal Location
This command assumes you're running from the root directory of the gateway. If running from a different directory, adjust the path to the docker-compose file accordingly.
Verify Deployment
Check that Grafana is running properly:
docker compose -f docker-compose.grafana.yaml logs -f --tail=25Press Ctrl+C to exit the logs. Look for any error messages or permission issues.
Access Grafana
Navigate to http://localhost:1024 in your browser to access Grafana.
Default credentials:
- Username:
admin - Password:
admin
Credential Reset
Updated credentials may be lost if the Grafana sidecar is restarted. Be sure to log into Grafana immediately after every startup to ensure Grafana cannot be accessed with the default credentials.
Exposing Dashboard Publicly
To expose your Grafana dashboard externally through your domain, you'll need to configure nginx as a reverse proxy. This requires DNS setup and SSL certificates as covered in the gateway installation guide.
Prerequisites
This setup assumes you've already configured DNS, SSL certificates, and nginx as described in the Installation & Setup guide.
Deploy Grafana Sidecar
First, ensure your Grafana container is running:
docker compose -f docker-compose.grafana.yaml up -dVerify it's accessible locally at http://localhost:1024.
Update Nginx Configuration
Edit your existing nginx configuration file (/etc/nginx/sites-available/default) to add the Grafana location block:
# Add this block inside your existing HTTPS server block (port 443)
location /grafana/ {
    proxy_pass http://localhost:1024/grafana/;
    proxy_set_header Host $host;
    proxy_set_header X-Real-IP $remote_addr;
    proxy_set_header X-Forwarded-For $proxy_add_x_forwarded_for;
    proxy_set_header X-Forwarded-Proto $scheme;
}
Your complete nginx configuration should look like this:
# Force redirects from HTTP to HTTPS
server {
    listen 80;
    listen [::]:80;
    server_name <your-domain>.com *.<your-domain>.com;

    location / {
        return 301 https://$host$request_uri;
    }
}

# Forward traffic to your node and provide SSL certificates
server {
    listen 443 ssl;
    listen [::]:443 ssl;
    server_name <your-domain>.com *.<your-domain>.com;

    ssl_certificate /etc/letsencrypt/live/<your-domain>.com/fullchain.pem;
    ssl_certificate_key /etc/letsencrypt/live/<your-domain>.com/privkey.pem;

    location / {
        proxy_pass http://localhost:3000;
        proxy_set_header Host $host;
        proxy_set_header X-Real-IP $remote_addr;
        proxy_set_header X-Forwarded-For $proxy_add_x_forwarded_for;
        proxy_http_version 1.1;

        # Forward ar.io headers if present in the request
        proxy_set_header X-AR-IO-Origin $http_x_ar_io_origin;
        proxy_set_header X-AR-IO-Origin-Node-Release $http_x_ar_io_origin_node_release;
        proxy_set_header X-AR-IO-Hops $http_x_ar_io_hops;
    }

    # Grafana dashboard access
    location /grafana/ {
        proxy_pass http://localhost:1024/grafana/;
        proxy_set_header Host $host;
        proxy_set_header X-Real-IP $remote_addr;
        proxy_set_header X-Forwarded-For $proxy_add_x_forwarded_for;
        proxy_set_header X-Forwarded-Proto $scheme;
    }
}
Test and Reload Nginx
Validate your nginx configuration:
sudo nginx -tIf the configuration is valid, reload nginx:
sudo systemctl reload nginxAccess Your Dashboard
Navigate to https://<your-domain>.com/grafana/ in your browser to access your Grafana dashboard externally.
Default credentials:
- Username:
admin - Password:
admin
Troubleshooting
Security Considerations
Default Credentials
Always change the default admin credentials immediately after first login. Default credentials are publicly known and pose a security risk.
Best Practices
- Change Default Password - Use a strong, unique password
- Enable HTTPS - Use SSL certificates for external access
- Restrict Access - Use firewall rules to limit access
- Regular Updates - Keep Grafana updated to latest version
- Backup Configuration - Export and backup dashboard configurations
Documentation & Support
- Grafana Documentation - Official Grafana docs
- Prometheus Metrics - Understanding gateway metrics
- Community Support - Join the Ar.io Discord for help
Useful Docker Commands
Monitor and manage your Grafana sidecar with these commands:
# View all running services
docker ps

# Start Grafana sidecar
docker compose -f docker-compose.grafana.yaml up -d

# Stop Grafana sidecar
docker compose -f docker-compose.grafana.yaml down

# Pull latest Grafana images
docker compose -f docker-compose.grafana.yaml pull

# Follow Grafana logs
docker compose -f docker-compose.grafana.yaml logs -f --tail=25

# Check Grafana container status
docker compose -f docker-compose.grafana.yaml ps

# Restart Grafana sidecar
docker compose -f docker-compose.grafana.yaml restart

# View Grafana logs without following
docker compose -f docker-compose.grafana.yaml logs --tail=50

# Start Grafana in foreground (for debugging)
docker compose -f docker-compose.grafana.yaml up

# Check port availability
netstat -tulpn | grep :1024
Next Steps
Now that you have monitoring set up, continue building your gateway infrastructure:
Optimize Performance
Learn advanced gateway optimization techniques for better performance
Add ClickHouse
Improve query performance with ClickHouse and Parquet integration
Deploy Bundler
Accept data uploads directly through your gateway
Run Compute Unit
Execute AO processes locally for maximum efficiency
How is this guide?